
Understanding the Mailzzy Dashboard
Last updated on May 14, 2026
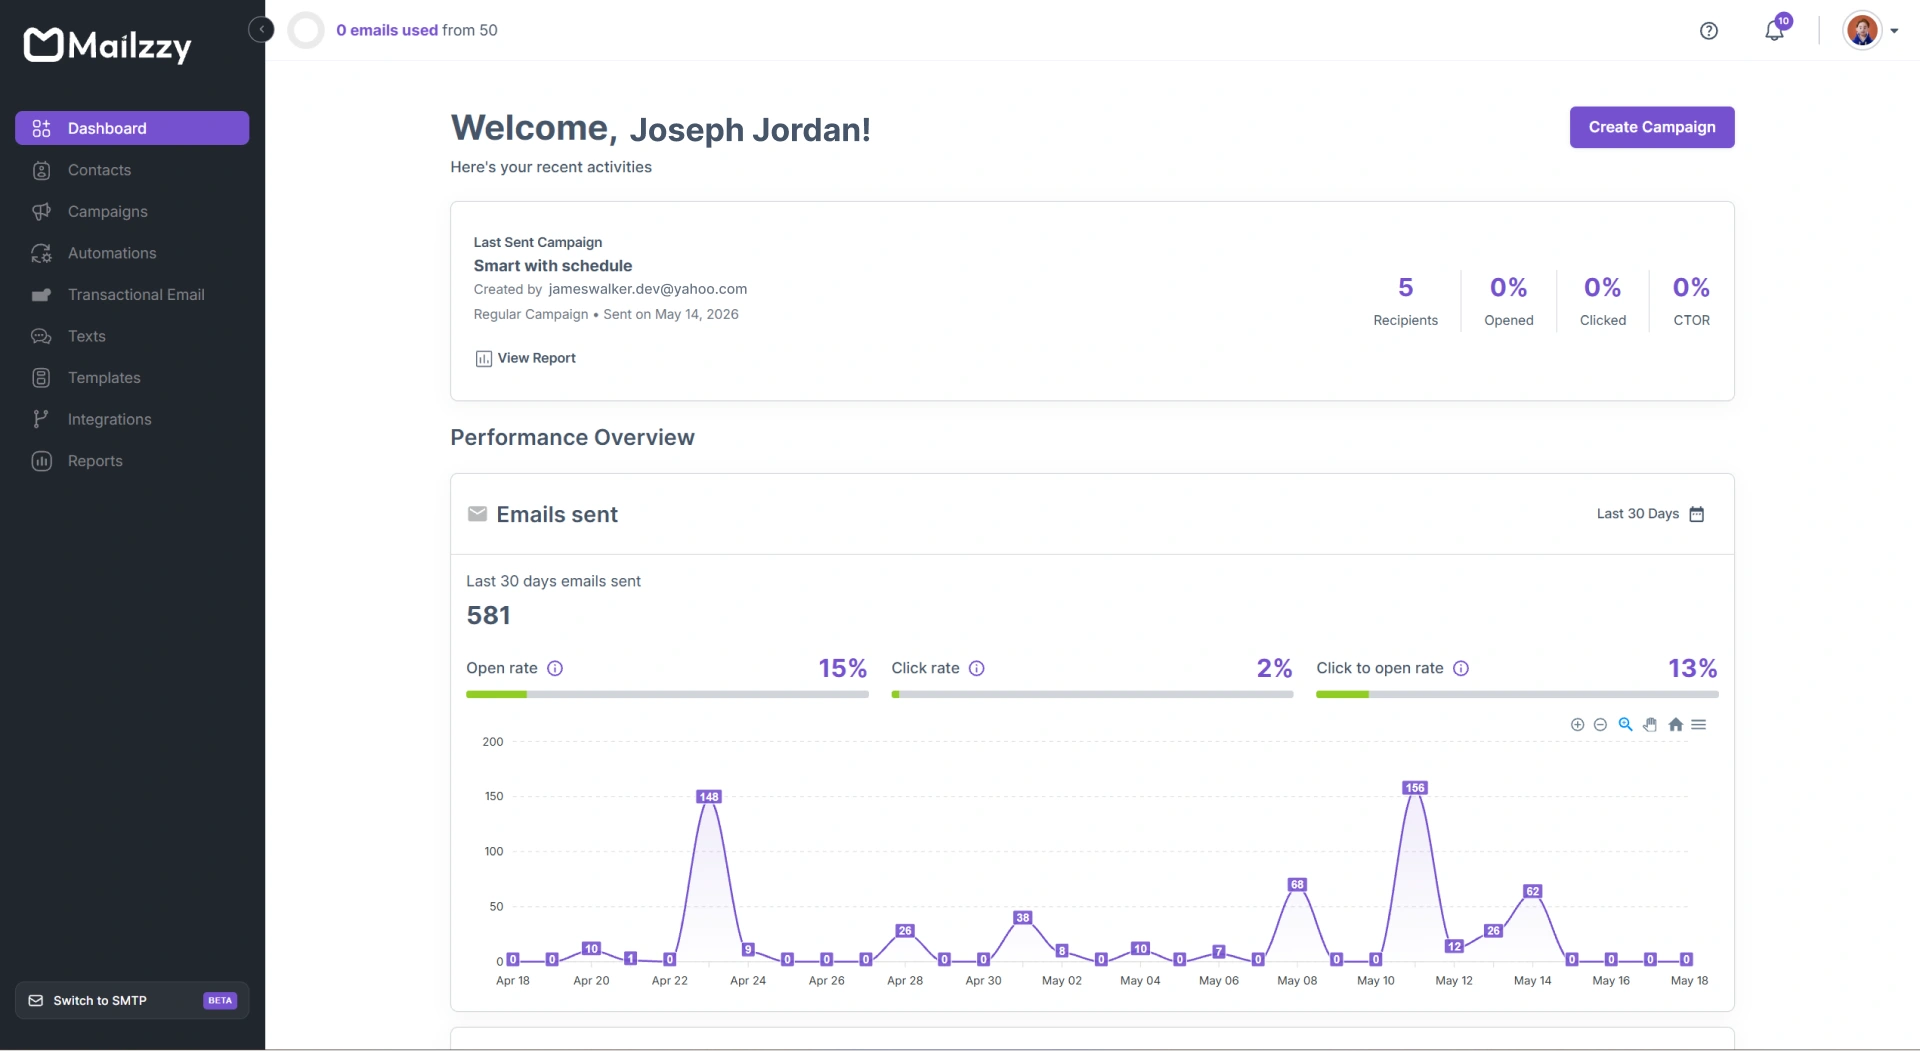
When you log in to Mailzzy, the first thing you see is your dashboard. It provides a quick overview of your account activity and easy access to the most important areas of the platform. This guide explains what each section of the dashboard shows and how to use it effectively.
Recent Campaign Activity
The main section of your dashboard displays a summary of your most recent campaigns. For each campaign, you can quickly view key details such as:
- Campaign name
- Send status
- Number of recipients
- Open rate
- Click rate
- Click-to-open rate (CTOR)
You can click on any campaign to open its detailed report and analyze performance more closely.
Quick Stats
At the top of the dashboard, you’ll find key account statistics at a glance, including:
- Total number of contacts
- Total campaigns sent
- Overall engagement rates
These metrics give you a high-level view of your account performance and help you track progress over time.
Performance Overview
The Performance Overview section provides a snapshot of how your campaigns and contacts are performing within a selected date range. The data updates based on the calendar filter, allowing you to analyze performance for any specific period.
Emails
This section highlights your email activity and engagement metrics for the selected time period:
- Emails Sent: Total number of emails sent during the selected date range
- Open Rate: Percentage of recipients who opened your emails
- Click Rate: Percentage of recipients who clicked links in your emails
- Click-to-Open Rate (CTOR): Percentage of users who clicked after opening your email, indicating how engaging your content is
These metrics help you evaluate campaign effectiveness and identify opportunities to improve performance.
Contacts
This section provides insights into your contact list activity:
- Total Active Contacts: Number of contacts currently available in your account
- New Contacts Today: Contacts added on the current day
- New Contacts (Selected Period): Contacts added during the chosen date range
- Unsubscribed (Selected Period): Contacts who opted out during the selected time period
Monitoring these metrics helps you maintain a healthy contact list and understand audience growth trends.


Let's keep in touch
Sign up for our weekly email marketing newsletter and Mailzzy updates.
For more details, review our Privacy Policy


© 2026 Mailzzy. All rights reserved.